Z-Score Calculator
Find how many standard deviations any data point sits from the population mean.
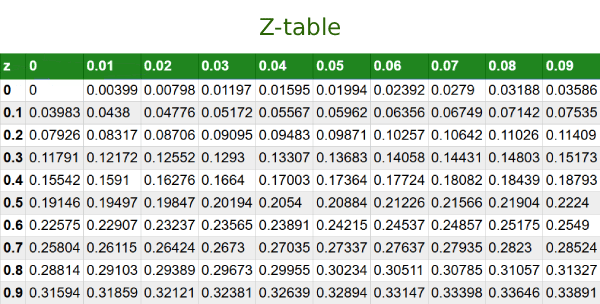
Z-score ↔ Probability Converter
—
—
—
—
—
Calculation Examples
How to Use the Z-Score Calculator
The calculator needs three values. Enter the raw score: the individual data point you are analyzing. Then provide the population mean, the arithmetic average of the full distribution you are referencing. Finally, enter the population standard deviation, which measures how spread out that distribution is.
Press Calculate and the result appears as a z-score. A positive value means the raw score sits above the mean; a negative value means it falls below. The output also shows the corresponding percentile so you can see immediately where the data point ranks within a normal distribution.
How the Z-Score Is Calculated
The z-score formula subtracts the population mean from the raw score and divides by the population standard deviation: \[z = \frac{x - \mu}{\sigma}\] This transforms any raw observation into a position on the standard normal distribution, which has a mean of \(\mu = 0\) and a standard deviation of \(\sigma = 1\). That shared scale is what makes z-scores so useful: values from completely different datasets become directly comparable once standardized.
Useful Tips 💡
- Use population parameters when the full dataset is known. For sample data, a t-score is more appropriate because it accounts for the added uncertainty of estimating the mean from a subset.
- Values with an absolute z-score above 3 are statistically unusual in a normal distribution and often warrant a closer look as potential outliers.
📋Steps to Calculate
-
Enter the raw score (the observed value you want to standardize).
-
Enter the population mean.
-
Enter the population standard deviation and press Calculate.
Mistakes to Avoid ⚠️
- Using sample standard deviation when the population standard deviation is required, this understates the z-score.
- Forgetting to subtract the mean before dividing, which produces a meaningless result.
- Assuming a z-score above 3 is impossible: it is simply rare, occurring in roughly 0.3% of a normal distribution.
- Plugging a z-score directly into further calculations as if it were still a raw score.
Practical Applications📊
Standardize test scores such as SAT, GRE, or IQ results for fair comparison across different test versions or populations.
Detect outliers in research datasets and quality-control monitoring by flagging values beyond a set z-score threshold.
Calculate cumulative probabilities and percentile ranks for any normally distributed variable.