BMI Calculator

Calculate your Body Mass Index using the WHO formula: BMI = weight (kg) / height² (m²). Results are classified against the international WHO thresholds - Underweight, Normal weight, Overweight, and Obese - with notes on clinical limitations for athletes, older adults, and Asian populations.
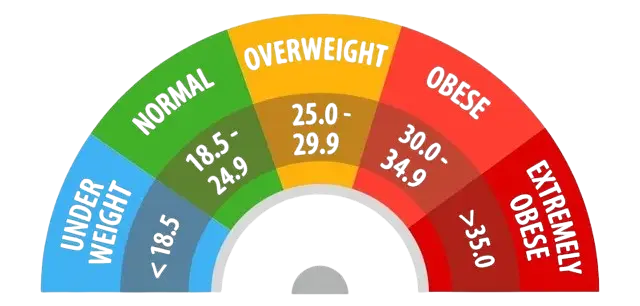
Estimated body fat percentage: %

Interpretation:
Standard BMI Categories (WHO / CDC for adults):
  • Underweight: < 18.5
  • Normal weight: 18.5 – 24.9
  • Overweight: 25.0 – 29.9
  • Obesity class I: 30.0 – 34.9
  • Obesity class II: 35.0 – 39.9
  • Obesity class III: ≥ 40.0
BMI is a screening tool only. It does not diagnose health. Estimated body fat % uses Deurenberg formula (BF% = 1.20 × BMI + 0.23 × Age − 10.8 × Sex − 5.4), where Sex = 1 for male, 0 for female. This is an approximation (SEE ≈ 4.1%). BMI does not account for muscle mass, ethnicity, pregnancy, etc. Consult a doctor for health assessment.

Important note: This calculator provides general estimates only. For accurate health assessment, please consult a qualified healthcare professional.

Was this calculator helpful?

4.8/5 (21 votes)

Calculation Examples

Calculation Case Result
Height 175 cm, Weight 70 kg BMI 22.9 - Normal weight
Height 180 cm, Weight 95 kg BMI 29.3 - Overweight
Height 160 cm, Weight 45 kg BMI 17.6 - Underweight
Height 170 cm, Weight 90 kg (athlete) BMI 31.1 - Note: may overestimate risk in high-muscle individuals

How to Use the BMI Calculator?

Enter your height and weight into their respective fields. Choose your units (kilograms or pounds for weight, meters or feet for height) and click "Calculate" to determine your BMI. The result displays your Body Mass Index value and the corresponding WHO weight classification: Underweight, Normal weight, Overweight, or Obese.

BMI is a validated population-level screening tool recommended by the World Health Organization for initial weight-related risk assessment. It is one of the most widely used clinical screening metrics in primary care settings globally, used alongside waist circumference and clinical history for a complete assessment.

Obesity Reasons and Prevention

Limitations of BMI

The Body Mass Index is a population-level screening indicator derived from height and weight. It does not measure body fat directly and has several well-documented clinical limitations. BMI cannot distinguish between fat mass and lean mass: a highly muscular athlete may register as "Overweight" at BMI 27 while carrying very low body fat, whereas an older adult with age-related muscle loss (sarcopenia, as defined by the European Working Group on Sarcopenia in Older People, EWGSOP) may have a "Normal" BMI of 22 while carrying an elevated proportion of adipose tissue.

Additionally, the standard adult WHO thresholds (overweight ≥25, obese ≥30) are not appropriate for children and adolescents - who require age- and sex-specific BMI-for-age percentiles - or for pregnant women. For Asian populations, research published in The Lancet (WHO Expert Consultation, 2004) demonstrated that metabolic risk, including Type 2 diabetes and cardiovascular disease, begins at lower BMI values, leading to recommended cut-offs of ≥23.0 for overweight and ≥27.5 for obesity in these populations. For a comprehensive health assessment, BMI should be interpreted alongside waist circumference and, where available, body fat percentage.

BMI Classification Chart: Underweight, Normal, Overweight, Obese thresholds

Useful Tips 💡

  • For consistent tracking, measure weight and height under the same conditions each time - ideally in the morning before eating, without shoes, and in light clothing.
  • If you are monitoring BMI over time, record your measurements in the same unit system (metric or imperial) to keep comparisons valid.
  • BMI is a lagging indicator that changes slowly. For week-to-week health monitoring, focus on daily metrics such as caloric intake, activity level, and sleep quality rather than BMI alone.

📋Steps to Calculate

  1. Enter your weight and height in the fields provided.

  2. Select your preferred unit system: metric (kg/cm) or imperial (lbs/inches).

  3. Click "Calculate" to view your BMI value and WHO weight classification.

Mistakes to Avoid ⚠️

  1. Mixing unit systems - for example, entering weight in kilograms but selecting the "pounds" option, which will produce a significantly incorrect result.
  2. Using BMI as the sole health metric for athletes or strength trainers, who often have elevated muscle mass that the formula cannot differentiate from fat mass.
  3. Applying the standard adult calculator to children under 18 (who require BMI-for-age percentile charts) or pregnant women (where normal weight gain affects the reading).

Practical Applications📊

  1. Track your weight category over time as part of a personal health monitoring routine - checking every 3 to 6 months provides meaningful trend data without over-measurement.

  2. Use BMI alongside our Calorie Calculator (TDEE) to establish a science-based caloric target for weight management.

  3. If BMI places you near a category boundary or you have significant muscle mass, cross-reference with our Body Fat Calculator (US Navy Method) for a more accurate body composition picture.

Questions and Answers

What is a BMI calculator and how does it work?

A BMI calculator applies the Quetelet Index formula developed by Adolphe Quetelet in 1832 and later adopted by the World Health Organization as a population-level screening tool: $BMI = \frac{\text{weight (kg)}}{\text{height}^2 \text{ (m)}}$. For a person 175 cm tall and weighing 70 kg: $BMI = \frac{70}{1.75^2} = \frac{70}{3.0625} = 22.9$. The resulting value is mapped to one of four WHO weight status categories. BMI measures weight relative to height - it does not directly measure body fat percentage, and its clinical utility is best understood as a screening indicator rather than a diagnostic tool.

What are the WHO BMI classification thresholds for adults?

The international WHO classification for adults aged 20 and older uses four primary categories: Underweight ($BMI < 18.5$), Normal weight ($18.5 \leq BMI < 25.0$), Overweight ($25.0 \leq BMI < 30.0$), and Obese ($BMI \geq 30.0$). Obesity is further sub-classified into Class I ($30.0–34.9$), Class II ($35.0–39.9$), and Class III ($\geq 40.0$). These thresholds are consistent across men and women for the general adult population. However, BMI does not distinguish between body fat and muscle mass: at the same BMI, women typically carry a higher fat percentage than men, and athletes may be classified as overweight despite low body fat.

Why is BMI-for-age percentile used for children and teenagers?

In children and adolescents, body fat levels change substantially during normal growth and development, making fixed adult thresholds inappropriate. Healthcare providers use BMI-for-age percentile charts, which compare a child's BMI against a reference population of the same age and sex. In the US, the CDC reference charts classify underweight as below the 5th percentile, healthy weight as the 5th to 85th percentile, overweight as the 85th to 95th percentile, and obesity as at or above the 95th percentile. The WHO also publishes separate growth reference charts for children aged 5–19. This approach accounts for the normal variation in body composition during puberty and growth spurts.

What are the primary limitations of using BMI as a health metric?

The principal limitation of BMI is its inability to differentiate between fat mass, muscle mass, and bone density. This produces two systematic errors: it may overestimate health risk in muscular individuals (a professional athlete at BMI 28 is not overweight in the clinical sense), and it may underestimate risk in older adults experiencing sarcopenia - age-related muscle loss first formally defined by Rosenberg (1989) - who may have a "Normal" BMI while carrying an elevated proportion of visceral fat. For a more complete body composition assessment, BMI should be used alongside waist circumference (cardiovascular risk rises significantly above 102 cm in men and 88 cm in women, per NHLBI guidelines) and body fat percentage estimated by methods such as the US Navy circumference method (±3% margin of error vs. hydrostatic weighing).

Do BMI thresholds differ for Asian populations?

Yes. A WHO Expert Consultation report published in The Lancet (Vol. 363, Issue 9403, January 2004) found that Asian populations face elevated metabolic risk - including Type 2 diabetes and cardiovascular disease - at lower BMI values than Western populations. The consultation proposed action points at $BMI \geq 23.0$ for increased risk and $BMI \geq 27.5$ for high risk in Asian populations, compared to the standard cut-offs of 25.0 and 30.0. These lower thresholds reflect differences in body fat distribution: Asian individuals tend to accumulate more visceral adipose tissue at equivalent BMI levels compared to European populations. Many Asian national health authorities, including those in China, Japan, South Korea, and India, have adopted these adjusted thresholds in their clinical guidelines.

How often should I track my BMI for effective health monitoring?

Checking BMI every 3 to 6 months is generally sufficient for monitoring long-term weight trends. BMI is a lagging indicator - it responds slowly to changes in diet and exercise and lacks the sensitivity to reflect week-to-week fluctuations in body composition. For active health management, more informative daily metrics include caloric balance relative to TDEE (Total Daily Energy Expenditure), macronutrient intake, and NEAT (Non-Exercise Activity Thermogenesis, i.e., the calories burned through incidental daily movement). BMI is most useful as a periodic checkpoint that contextualizes these shorter-term metrics within a longer-term weight trend.
Disclaimer: This calculator is designed to provide helpful estimates for informational purposes. While we strive for accuracy, financial (or medical) results can vary based on local laws and individual circumstances. We recommend consulting with a professional advisor for critical decisions.