Standard Deviation Calculator
Calculate Standard Deviation and Variance for Any Dataset Online.
Calculation Examples
Sample vs. Population Standard Deviation
Before calculating, determine your dataset type. Use Population if you have complete data for every member of a group. Use Sample (the most common in practice) if your data represents a subset drawn from a larger population. The sample calculation applies Bessel's correction, dividing by n minus 1 rather than n, which corrects the systematic underestimation of true variability that occurs when working with partial data.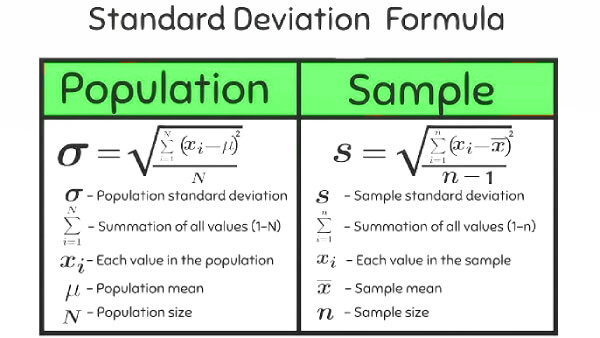
Applications of Standard Deviation
Standard deviation quantifies how much individual data points deviate from the mean, making it one of the most widely applied statistics across disciplines. In manufacturing and quality control, a low standard deviation confirms that a production process is consistent and operating within specification tolerances. A sudden rise signals process drift before defects become visible.
In finance, standard deviation is the standard measure of investment volatility: a portfolio with a high standard deviation carries greater return variability and therefore greater risk. In meteorology, it quantifies climate variability to improve forecasting reliability. In clinical research, it determines whether observed differences between groups are statistically meaningful or within normal random variation. Wherever data-driven decisions matter, standard deviation is the starting point for rigorous analysis.
Useful Tips 💡
- Remove any non-numeric characters from your dataset before entering values, as they will cause calculation errors.
- Select "Sample" if your data represents a subset of a larger group; using the Population formula on a sample systematically underestimates true variability.
📋Steps to Calculate
-
Enter your dataset as comma-separated values.
-
Select whether your data is a Sample or a full Population.
-
Click "Calculate" to receive standard deviation, variance, mean, and count instantly.
Mistakes to Avoid ⚠️
- Applying the Population formula to a sample dataset, which divides by n instead of n minus 1 and underestimates the true variability of the broader group.
- Confusing Variance with Standard Deviation. Variance is the average of squared deviations; Standard Deviation is its square root, expressed in the same units as the original data.
- Overlooking outliers. A single extreme value can disproportionately inflate standard deviation, masking the typical spread of the rest of the dataset.
Practical Applications📊
Assess data variability for quality control, academic research, or financial risk analysis.
Use alongside our Scientific Calculator for broader statistical workflows.
Compare the spread of multiple datasets to identify trends, outliers, or process inconsistencies.