Standard Deviation Calculator

Calculate standard deviation and variance for any sample or population dataset online.

Last updated:
Numbers (comma-separated):
Enter numbers (e.g., 1,2,3,4,5)
Unit (optional):
None
Kilometers
Miles
Kilograms
Pounds
Type:
Population
Sample
Calculate
Clear
Please enter a list of numbers.
Please enter at least two valid numbers.
Calculation Results
Input Numbers:
Number of Values (n):
Mean (μ):
Number (x)
Deviation (x - μ)
Squared Deviation (x - μ)²
Sum of Squared Deviations:
Population Statistics
Population Variance (σ²):
Population Standard Deviation (σ):
Sample Statistics
Sample Variance (s²):
Sample Standard Deviation (s):
Step-by-Step Calculation
Step 1: Calculate the Mean
Mean = (Sum of numbers) / n =
Step 2: Calculate Deviations from the Mean
For each number, subtract the mean: (x - μ)
See the table above for deviations.
Step 3: Square the Deviations
For each deviation, compute (x - μ)²
See the table above for squared deviations.
Step 4: Sum the Squared Deviations
Sum =
Step 5: Calculate Variance
For Population: σ² = (Sum of squared deviations) / n =
For Sample: s² = (Sum of squared deviations) / (n - 1) =
Step 6: Calculate Standard Deviation
For Population: σ = √(σ²) = √
For Sample: s = √(s²) = √
Numbers (comma-separated):
Unit (optional):
Type:

Was this calculator helpful?

★ ★ ★ ★ ★
Embed this calculator

Calculation Examples

Calculation Case Result
Data: 10, 20, 30 (sample) SD = 10 / Var = 100 (population: SD = 8.16 / Var = 66.67)
Data: 2, 4, 4, 4, 5, 5, 7, 9 (population) SD = 2 / Var = 4 (sample: SD = 2.138 / Var = 4.571)
Set of identical numbers (5, 5, 5) SD = 0 / Var = 0
Mihail Doncenco
Mihail Doncenco Site Creator & Calculator Expert

Founder and developer of CalcMate. Builds and maintains every calculator on this site, focusing on formula accuracy and clear, practical results.

Sample vs. Population Standard Deviation

Pick the dataset type first. Use Population if your data covers every member of the group. Use Sample (the usual case) if your data is a subset of a larger group. The sample calculation applies Bessel's correction: it divides by \(n - 1\) instead of \(n\), because the sample mean sits closer to the sample values than the true mean does, so dividing by \(n\) underestimates the variance.

Example with 2, 4, 4, 4, 5, 5, 7, 9: the mean is 5 and the squared deviations add up to 32. Population: variance \(\dfrac{32}{8} = 4\) and SD = 2. Sample: variance \(\dfrac{32}{7} = 4.571\) and SD = 2.138.
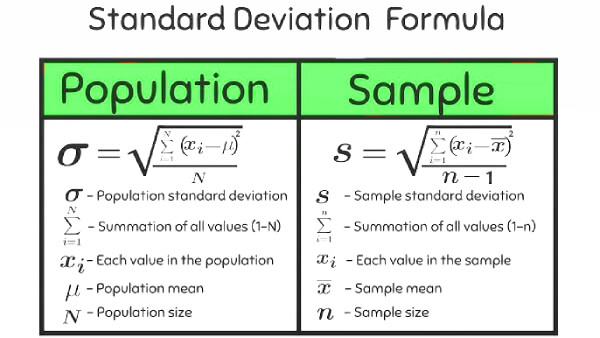
Standard deviation formula for population and sample

Applications of Standard Deviation

Standard deviation measures how far data points typically sit from the mean, so it shows up in many fields. In manufacturing, a bottling line with a mean fill of 500 mL and an SD of 2 mL puts about 95% of bottles between 496 and 504 mL if fills are roughly normal. A rising SD warns of process drift before defects appear.

In finance, the SD of returns is the standard volatility measure: a daily SD of 1% scales to about \(1\% \times \sqrt{252} \approx 15.9\%\) per year, using 252 trading days and assuming independent daily returns. In clinical research, SD describes the spread inside each group and feeds the tests that decide whether a difference between groups is larger than random variation. In education, it drives grading curves and z-scores.

Useful Tips 💡

  • Remove any non-numeric characters from your dataset before entering values, as they will cause calculation errors.
  • Select "Sample" if your data is a subset of a larger group. For 10, 20, 30, the sample SD is 10 and the population SD is 8.16, so the wrong choice shifts the answer by about 18%.
  • Check the units. SD has the same unit as your data, while variance has squared units. A height SD of 7 cm means a variance of 49 cm².

📋Steps to Calculate

  1. Enter your dataset as comma-separated values.

  2. Select whether your data is a Sample or a full Population.

  3. Click "Calculate" to receive standard deviation, variance, mean, and count instantly.

Mistakes to Avoid ⚠️

  1. Using the Population formula on a sample. It divides by n instead of n - 1, so for 10, 20, 30 it gives 8.16 instead of 10 and understates the variability of the wider group.
  2. Confusing variance with standard deviation. Variance is the average squared deviation, and SD is its square root, in the same units as the data.
  3. Overlooking outliers. In 10, 12, 11, 13, 90, the sample SD is 35.1, but without the 90 it is 1.3. One extreme value can hide the real spread of the rest.
  4. Applying the 68-95-99.7 rule to skewed data. It describes roughly normal distributions only, so do not use it for income, waiting times, or other skewed data.

Practical Applications📊

  1. Quality control: two production lines both average 100 g. Line A has an SD of 0.5 g and line B has an SD of 2 g, so line B needs tighter control even though the averages match.

  2. Finance: multiply a daily SD by √252 to estimate annual volatility. A 1% daily SD is about 15.9% per year.

  3. Research reporting: report the mean with its SD, and divide the SD by √n to get the standard error. For SD = 2.138 and n = 8, SE = 0.756. The Scientific Calculator helps with the square root.

  4. Outlier screening: in roughly normal data, only about 0.27% of values lie more than 3 SD from the mean, so such points deserve a second look.

Questions and Answers

Can the Standard Deviation Calculator handle large datasets?

Yes, it accepts comma-separated values and can process hundreds of entries in one step. That covers most coursework, research, and business analysis. For millions of rows, use R, Python, or SQL instead. Check the default in each tool: Excel has STDEV.S (sample) and STDEV.P (population), R sd() divides by \(n - 1\), and NumPy np.std() divides by \(n\) unless you set ddof=1.

How do I use this standard deviation calculator?

Enter your values separated by commas, choose Sample or Population, and click "Calculate." The tool returns the standard deviation, variance, mean, and count at the same time, with no manual summing or square roots. Make sure the dataset contains only numbers before you submit. If you are unsure which type to pick, choose Sample, which is the right choice whenever your data is only part of a bigger group.

How do you calculate standard deviation step by step?

Find the mean, subtract it from each value, square the deviations, average them, and take the square root. The average divides by \(N\) for a population or by \(n - 1\) (Bessel's correction) for a sample, and the result is the variance. Example with 2, 4, 4, 4, 5, 5, 7, 9: the mean is 5, the deviations are -3, -1, -1, -1, 0, 0, 2, 4, and the squares add up to 32. The sample variance is \(\dfrac{32}{7} = 4.571\), so \(s = \sqrt{4.571} = 2.138\). The sample formula is \(s = \sqrt{\dfrac{\sum (x_i - \bar{x})^2}{n-1}}\).

What is a standard deviation calculator and why is it useful?

A standard deviation calculator measures how spread out the values in a dataset are around the mean. A low SD means the values cluster tightly, and a high SD means they are widely dispersed. For example, 49, 50, 51 and 30, 50, 70 both average 50, but their SDs are 1 and 20. SD underpins risk assessment in finance, tolerance analysis in manufacturing, significance testing in research, and grading curves in education. The calculator returns SD, variance, mean, and count in one step.

What is the 68-95-99.7 rule and how does standard deviation relate to it?

In a normal distribution, about 68% of values fall within 1 SD of the mean, 95% within 2 SD, and 99.7% within 3 SD (more precisely 68.27%, 95.45%, and 99.73%). This is the Empirical Rule. Example: with a mean of 100 and an SD of 15, about 95% of values lie between 70 and 130. Values beyond 3 SD occur in only about 0.27% of cases, so they are worth checking. Quality control uses the same idea: Six Sigma places the specification limits 6 SD from the process mean, which allows 3.4 defects per million after a conventional 1.5 SD drift.

What is the difference between sample and population standard deviation?

The difference is the denominator: population SD divides by \(N\), and sample SD divides by \(n - 1\). Population SD (\(\sigma\)) is for data that includes every member of the group: \(\sigma = \sqrt{\dfrac{\sum (x_i - \mu)^2}{N}}\). Sample SD (\(s\)) is for a subset: \(s = \sqrt{\dfrac{\sum (x_i - \bar{x})^2}{n-1}}\). The \(n - 1\) (Bessel's correction) compensates for the sample mean being closer to the sample values than the true mean is. This makes the sample variance unbiased, although the sample SD itself is still very slightly biased low, especially for small \(n\).

What is the difference between sigma and s in statistics?

Sigma (\(\sigma\)) is the population standard deviation, and \(s\) is the sample standard deviation. Use \(\sigma\) when the data is the whole group and \(s\) when it is a sample used to estimate a larger group. Using \(\sigma\) on a sample underestimates variability, while using \(s\) on a full population adds an unneeded correction. The sample SD also feeds the standard error, \(SE = \dfrac{s}{\sqrt{n}}\), which shows how precisely the sample mean estimates the true mean. Example: \(s = 2.138\) and \(n = 8\) give \(SE = 0.756\).

Which formulas does the Standard Deviation Calculator use?

For a full population, the calculator uses \(\sigma = \sqrt{\dfrac{\sum (x_i - \mu)^2}{N}}\), where \(\mu\) is the population mean and \(N\) is the count. For a sample, it uses \(s = \sqrt{\dfrac{\sum (x_i - \bar{x})^2}{n-1}}\), where \(\bar{x}\) is the sample mean and \(n - 1\) is the degrees of freedom left after estimating the mean. The variance is the square of each result: \(\sigma^2\) or \(s^2\). These are the standard definitions in introductory and advanced statistics courses.
Disclaimer: This calculator is designed to provide helpful estimates for informational purposes. While we strive for accuracy, financial (or medical) results can vary based on local laws and individual circumstances. We recommend consulting with a professional advisor for critical decisions.